Research Report
Detailed Analysis for Yanchang
The key factors having the most substantial impact on annual household income include the type of transportation used by the family, the respondent’s risk preference, the cost of hired labor for the family, the total cost of agricultural planting, and income-related data. (From recursive feature elimination) The cost of hired labor and the total cost of agricultural planting are consistent with the results of the field visits conducted by the interviewers. However, the aspects of transportation and the farmers’ risk preferences offer new perspectives for the project. The previously mentioned factors are direct influencers of cold storage facilities, suggesting that they could be considered as having a direct impact on cold storage. At the same time, subsequent policy subsidies will also consider subsidizing farmers' transportation and addressing farmers’ risk preferences, including sales timing and online sales channels, with an increase in grassroots advocacy work.
Family Income
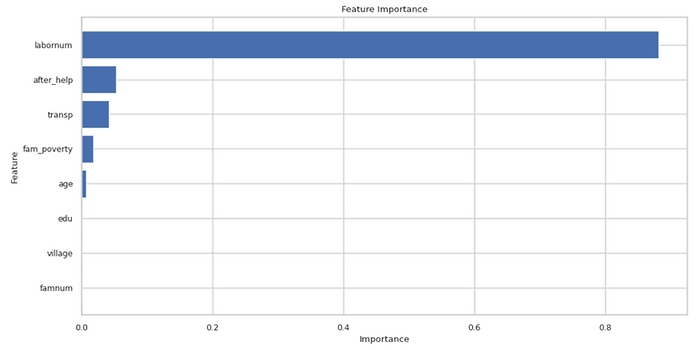
Figure 1: Factor Importance Influencing Farmer’s Income via Random Forest
It can be seen that some factors are consistent with recursive feature elimination, while others differ due to the importance of factors in this analysis being based on the random forest method, which does not account for correlations between factors. This allows us to see more intuitively which changes in factors can cause significant variations in annual household income. According to the chart, the number of laborers in a household has a direct impact of over 88% on annual household income, indicating that the quantity of family labor is the most critical factor leading to an increase in annual household income. This observation aligns with the previous section’s discussion of the impact of hired labor on annual income. Simultaneously, interviewers discovered through conversations with villagers that an increase in family labor significantly reduces the need for hired workers, thereby directly lowering substantial planting costs. Additionally, participation in the "IFU" project has more than a 5% impact on annual household income. This indicates that subsidies from the "IFU" project directly increase farmers’ willingness to participate in the insurance and futures policy, allowing them to receive compensation in disaster-affected years like the last one, thus reducing losses and increasing annual household income. This further validates the indispensable role of the "IFU" project in the implementation of insurance and futures as well as its irreplaceable importance in the process of assisting farmers.
Apple Selling Time
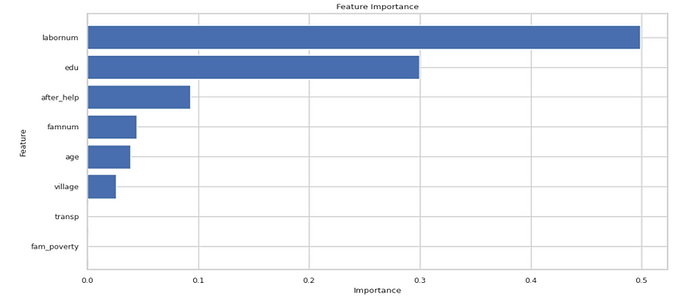
Figure 2: Factor Importance Influencing Apple Selling Time via Random Forest
It can be seen that the most crucial factors impacting the optimal timing for apple sales include whether the family is classified as poor, participation in the insurance and futures program, the farmers’ risk preference, apple cultivation land area, the rate of quality fruit, and the specific timing of sales. Notably, farmers’ risk preference plays a more significant role in determining sales timing than it does in household income. Apart from the direct index of risk preference, the insurance and futures program, and indicators such as the apple cultivation area and rate of quality fruit, expressed directly by farmers during field research, are key indicators of their aversion to risk. This suggests that the risk-related factors in family annual income are very likely caused in part by different apple sales timings. This analysis could guide future policies to pay more attention to information regarding farmers’ risk preferences, thereby better tailoring assistance methods and pathways.
According to Random forest method. The most critical factors are the number of working family members, the educational level of the family, whether they have participated in the "IFU" project, the total number of family members, the age of the head of the household, and the village they reside in. It can be seen that some factors align with those identified by Recursive Feature Elimination, while others differ, due to the importance of factors in this analysis being based on the decision tree method, which does not account for inter-factor correlations. It is evident that basic factors such as the number of family laborers, participation in the "IFU" project, and age indirectly affect the family’s annual income through their impact on the timing of apple sales. However, it is more important to consider how educational background and family size influence the timing of apple sales for farmers. Variations in selling times across different villages are due to the subtle differences in harvest times and the presence of different fruit dealers.
Sum Cost for Agriculture
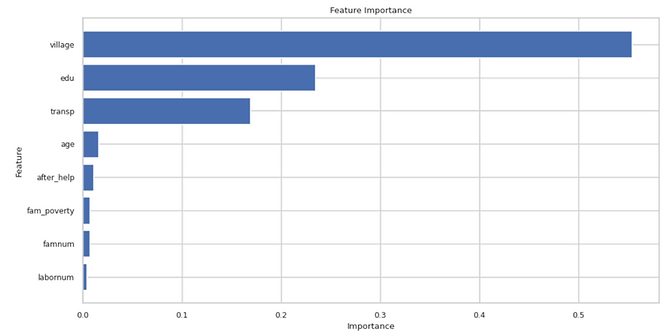
Figure 3: Factor Importance Influencing Apple Growing Cost via Random Forest
It can be seen that the three most decisive factors affecting the total planting cost are the village, the educational level, and the mode of transportation. The impact of the village on the total planting cost is a factor that needs attention; past assistance policies were implemented at the county level and overlooked the specific differences between villages. According to feedback from the surveyors, apart from the total planting costs, factors such as apple sales prices, yield per mu, and disaster impacts are also significantly affected by the locational factors between different villages. This suggests that, aside from direct cash subsidies, other assistance policies could be tailored to individuals and specific villages to achieve the most substantial results with the least cost. The recurring appearance of educational level and mode of transportation among the three most important influential factors also warrants attention. However, the specific mechanisms of their impact require further data collection and research analysis to draw conclusions.
Large-scale Fridge Analysis for Yanchang
Summary Statistics
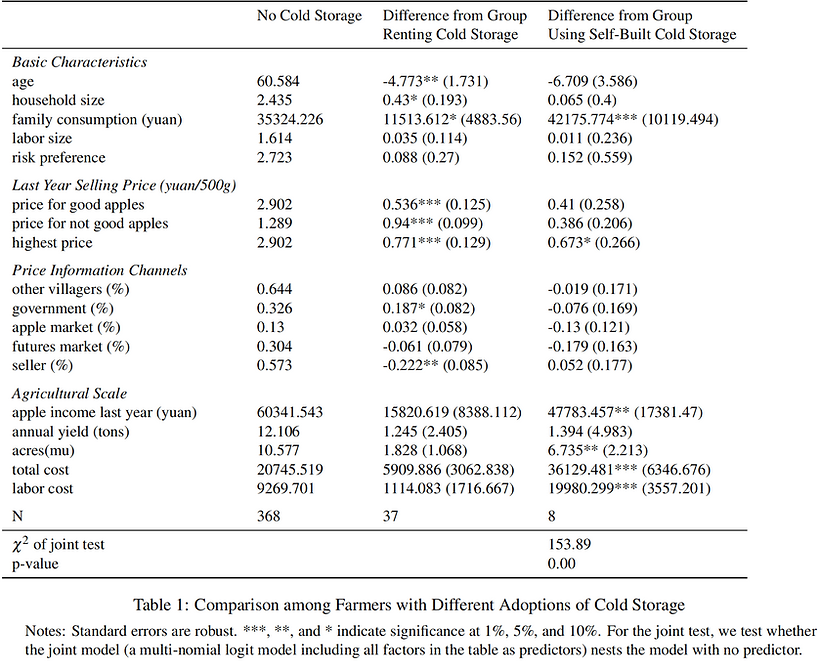
To investigate farmers’ decision process on the adoption of cold storage, let us first examine the realized patterns: how farmers who did not use cold storage last year were different from those who rented cold storage, and those who used self-build cold storage last year.
As shown in Table 1, farmers who used cold storage last year, on average, are younger and enjoy larger annual family consumption than those who did not use cold storage. Their distribution of apple selling price as a whole is also higher than the distribution of farmers who did not use cold storage: they experienced higher average price for good apples, higher average price for non-good apples, and higher maximum price, even though this phenomenon is much more statistically significant for farmers renting the cold storage than for those who had their own self-build cold storage.
A higher percentage of farmers who rented cold storage obtained price information from the government than those who did not use cold storage. In addition, a lower ratio of the renting group learned about price from the sellers/arbitragers. This pattern might reflect that the adoption of cold storage can allow farmers to exploit the price volatility (See section 2).
The farmers who used self-built cold storage on average faced statistically significantly larger scale of agricultural production: they owned larger farmland, faced higher labor cost and total costs, and obtained larger income from selling apples. Even though our current practice is by no means causal, the correlational analysis leads us to conjecture that when farmers decide whether to adopt cold storage, they face non-trivial fixed costs. These fixed costs might include the costs of accessing cold storage. In addition to the costs in the production process, the fixed costs might also include costs in the selling process. As we will show in Section 2, adopting cold storage allows farmers to increase the flexibility of their selling times, thereby better exploiting the market volatility and gaining profit. However, notice that this additional flexibility is conditional on farmers being able to successfully sell their commodities. Achieving this at a time when the arbitragers are less active might impose additional transaction costs on farmers by requiring them to obtain the trading information by themselves, or having connections with other arbitragers or buyers.
In addition to the individual tests, we also conduct joint tests to check whether these three groups of farmers are different from each other jointly along the observables. Not surprisingly, we reject the null hypothesis that these three groups are from the same distribution.
A caveat of the above analysis is that the sample sizes of the three groups of farmers are very different: we have 368 farmers who did not use cold storage, 37 farmers who rented cold storage, and only 8 farmers who used self-built cold storage. On one hand, this means that possibly the differences between farmers with no cold storage and farmers with self-built cold storage are much more statistically significant than those shown in Table 1. On the other hand, we have to pay additional attention to the possible selection effects.
Cold Storage and Selling Flexibility
In this section, we want to show that adopting cold storage might increase farmers’ selling flexibility, thereby allowing them to exploit the price volatility. Figure 4 illustrates the highest selling price for each farmer, and the month that the transaction with the highest price occurred. Clearly, farmers that did not use cold storage only sold their apples in November, the harvest season, while farmers who had access to cold storage were able to find the best transaction across the entire year. We simultaneously observe that a larger proportion of farmers without cold storage accepted price lower than average. These two facts, with the assumption that apples sold at the highest price are homogeneous, allow us to conjecture that farmers without cold storage accepted low prices during the harvesting season: Without the appropriate means to store apples, they have no alternatives. As a result, the adoption of cold storage frees farmers from this time constraint, allowing them to exploit price volatility, as shown for the other two groups in the graph.
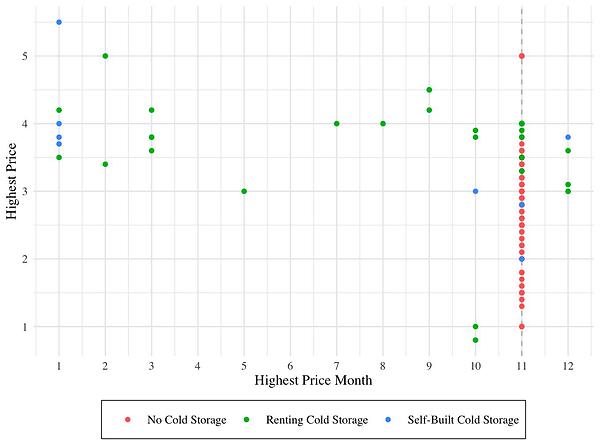
Figure 4: Highest Price Offer and the Month of the Offer by the Adoption of Cold Storage
We must highlight that this analysis might suffer omitted variable bias and reverse causality. Potentially, farmers using cold storages might have higher expertise, and thus can access the information necessary for them to exploit the price volatility over time. Also, maybe only farmers who own larger farmland and yield a large amount of apple adopt cold storage, and since their yields are large, they fail to sell them during the harvest season (usually November). A normal way to test the omitted variable bias is to use regression to check the partial correlation, yet since now we want to focus on the distribution of selling price over different months, this statistical tool is not very informative.
To examine the reverse causality concern, we generate Figure 5. Specifically, if farmers with access to cold storage sold apples across the year because they failed to do so earlier, then with the assumption that farmers who used cold storage faced similar information friction (if existed), we should observe a decrease of mode price over time, regardless of the quality of the apples: an excessive supply will lead to a decrease of price. However, we do not observe this pattern in Figure 5. In fact, conditional on the ratio of above-standard apples, the mode price was very stable across different months. Even though this does not mean that we formally reject the reverse causality hypothesis, we have thus conceptually argued that this is not likely to be the case.
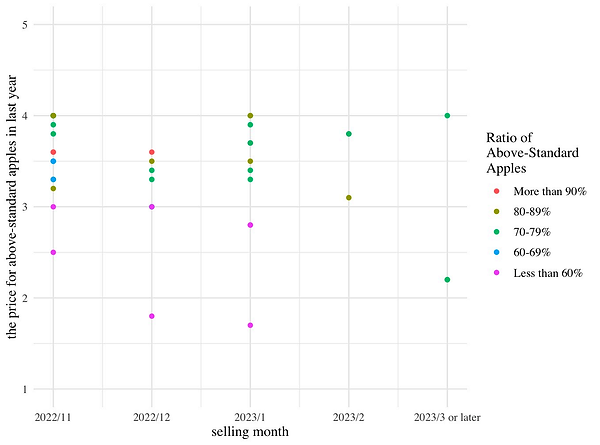
Figure 5 Mode Price for the Above-Standard Apples and Mode Month in which Sellings Occurred, Farmers with Access to Cold Storage
Cold Storage and Selling Flexibility
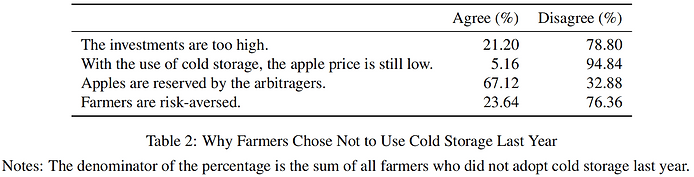
As we have finished discussing the potential benefits of adopting cold storage, we now want to examine why a lot of farmers did not use cold storage: Did they choose not to use cold storage? If this was the case, what were the reasons?
As shown in Table 2, the dominant reason of farmers not adopting cold storage last year is that all their apples were reserved by the arbitragers, so they did not need to store the apples by themselves. This somewhat confirms the point we have discussed in Section 1 that farmers’ additional control on selling time comes with transaction costs. If the amount of apples is not large enough, the farmers prefer to trade this flexibility to avoid the transaction costs. The second dominant reason for not adopting cold storage is that farmers are risk-averse. We can see from Figure 6 that the risk preference distribution for farmers without cold storage and that for farmers renting cold storage indeed appear different. (We do not discuss the farmers with self-built cold storage here, due to the limited sample size.) This does not contradict to the more risk-seekingness of farmers renting cold storages (as shown in Table 1). However, notice that the difference is not statistically significant. As a result, we refrain from claiming that Figure 6 and Table 1 confirm each other.
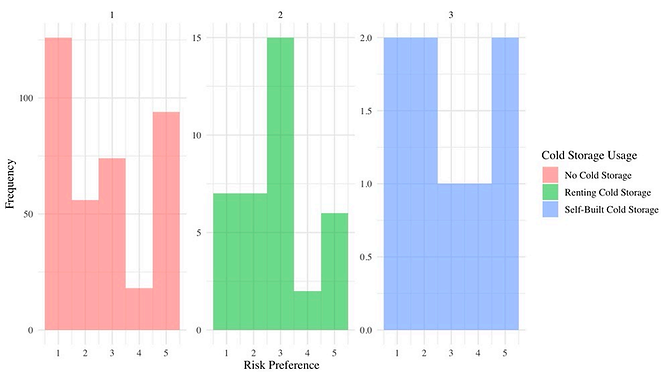
Figure 6: Histogram of Risk Preference by Cold Storage Usage
Notes: For risk preference (x-axis), 1 represents very risk-aversed, and 5 represents very risk-seeking.
A similar proportion of farmers chose not to adopt cold storage since they believed the investments were too high. However, notice that this reason combines two different types of concerns: (1) farmers face a budget constraint, so they have to resort to a corner solution, and (2) farmers optimize for an interior solution, but the marginal benefit of cold storage exceeds its marginal cost. However, we believe here that (1) is less likely to be the case. If we define the budget constraint as the budget for the entire household, then Table 1 shows that the average annual apple income far exceeds the average annual family consumption. If we confine the budget constraint as the budget for the production process alone, we can still see that even the average price for the below-average apple can normally cover the average price for renting the cold storage (given that cold storage for rent is available)